The first page you see when you open Webhook Guard — an at-a-glance summary of your
store's webhook activity for a chosen time window.
Choosing a Time Period
Use the period buttons in the top-right corner of the Dashboard to filter the cards
by a time window: Today, 7 Days,
15 Days, or 30 Days. All counts on the page update
to reflect only activity within that window.
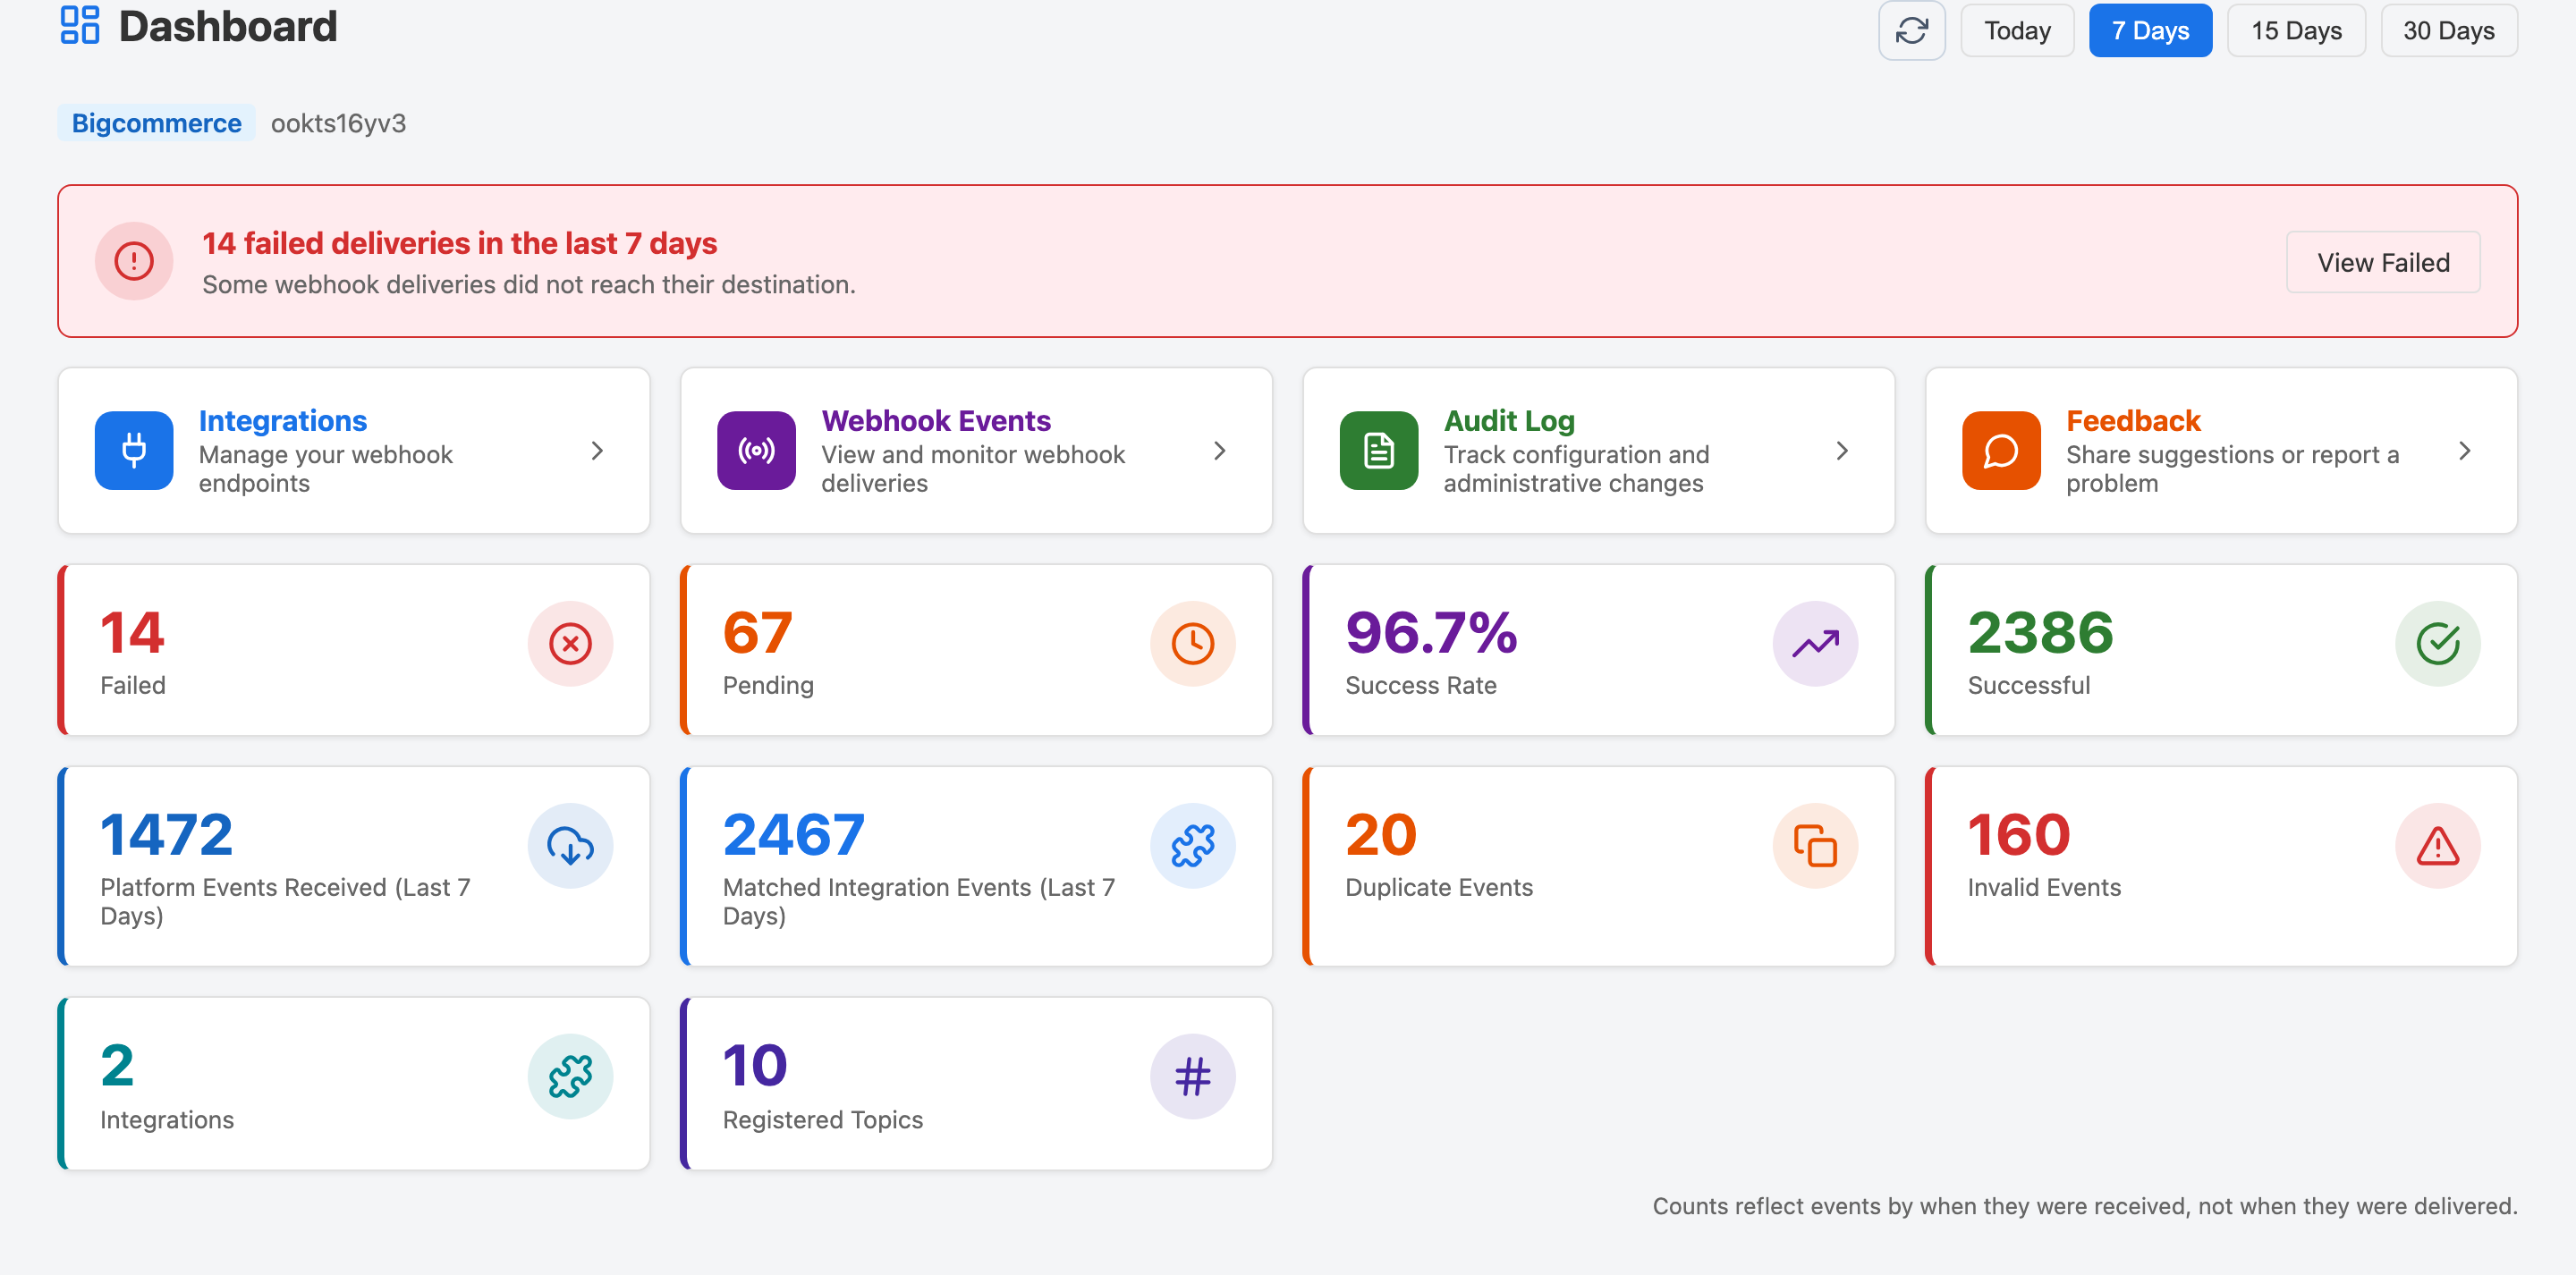
Summary Cards
Each card is clickable and navigates you directly to the relevant filtered view.
The Dashboard showing all summary cards and quick actions for the selected period.
Failed
Events where all delivery attempts to every matched integration failed.
Click to view failed events so you can investigate and retry them.
Pending
Events currently awaiting their first delivery attempt or queued for an
automatic retry. Click to see all pending events.
Success Rate
The percentage of matched integration events that were successfully delivered
in the selected period.
Successful
Events that were successfully forwarded to every matched integration.
Click to view only successful events.
Platform Events Received
The total number of raw webhook events received from your platform in the
selected period, before any matching or filtering.
Matched Integration Events
Events that matched at least one integration's topic subscriptions and were
forwarded for delivery. A single platform event can match multiple integrations.
Duplicate Events
Events your platform sent more than once within a short window. Webhook Guard
deduplicates them automatically and does not forward the extra copies.
Click to view the Duplicates tab.
Invalid Events
Events that failed HMAC signature verification. These are never forwarded to
your integrations. Click to view the Invalid Events tab.
Integrations
The number of integrations currently configured for your store. Click to go
to the Integrations page.
Registered Topics
The total number of webhook topic subscriptions registered with your platform
across all integrations. Click to go to the Integrations page.
Failed Delivery Banner
If there are failed deliveries in the selected period, a red banner appears at the
top of the cards area. It shows the number of failures and provides a
View Failed shortcut so you can investigate and retry without
having to navigate manually.
Quick Actions
Below the summary cards, the Dashboard shows a row of quick-action tiles.
These are shortcuts to the most commonly used pages:
Integrations, Webhook Events,
Audit Log, and Feedback.
🔄
Click the ↻ refresh button next to the period selector at any time
to reload the latest counts from the server without reloading the whole page.